
After your experience is published, you can monitor the result on the Experience Page.
Understanding your results
-
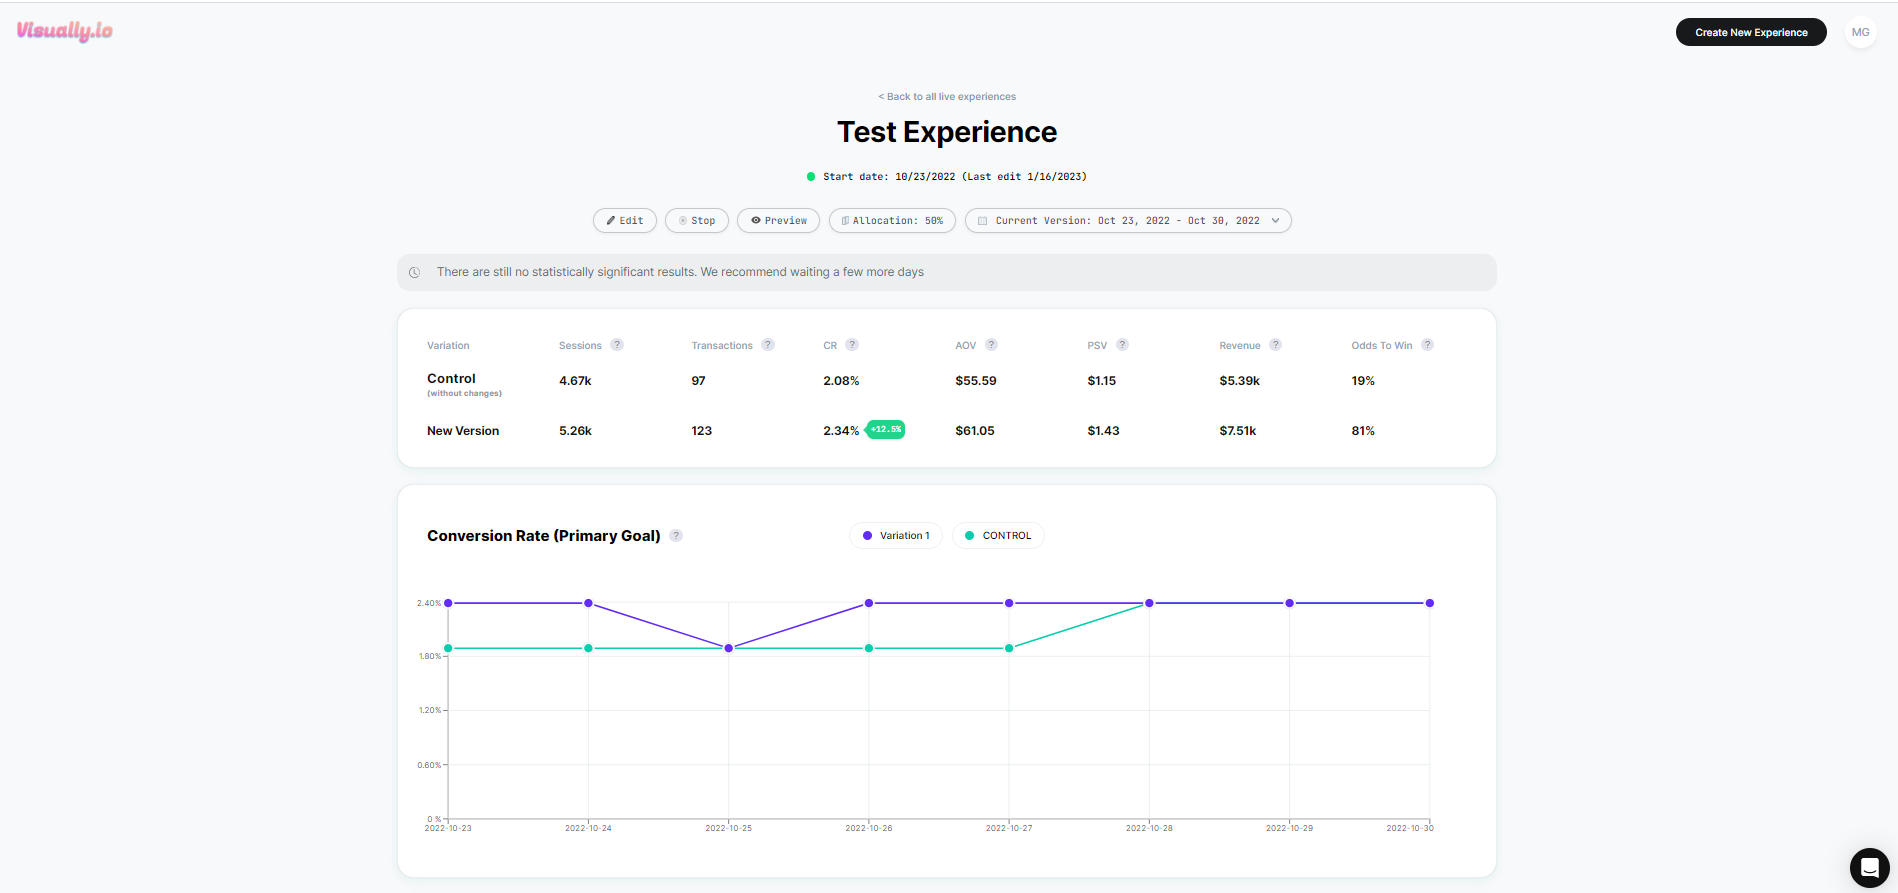
Control is the original version of your store
-
Variation(s) is/are the new version(s) you created
-
The Primary Goal that was set when the experience was pushed live will have a badge with the percentage of the change.
-
For each of the goals there is a Graph below that shows the results over time.
-
The Odds To Win is calculated based on the Primary Goal, by a Bayesian model.
Add and remove goals from your report
If you wish to add more goals to the tables and graphs, you can easily do so at the bottom of the page. To remove a goal, click on "Hide" next to its graph

Important Info
-
We recommend looking at data that includes only full days when the experience is running to obtain accurate measurements.
-
After making changes in the experience, it's important to reset the experience data to obtain clear results for each change that has been made. You will always have access to view the data from the previous versions on the Experience Report page.
- Traffic sources will only display when all variants have 10 or more sessions from that source.
When analyzing results for redirect experiences, make sure to only use Sessions with Impressions (SWI) or Users.
Data is refreshed ~once per hour.