

Step 1
As demonstrated in the screenshot, create two custom dimensions in Google Analytics:
1. VisuallyExperienceName
2. VisuallyVariation

Please wait for up to 48 hours before proceeding to the next step.
Step 2
Navigate to the Google Analytics menu and select the third option "Explore."
Step 3
Create new exploration.

Step 4
Create new segment.

Step 5
Create a new session segment.

Step 6
Add new condition and search for the event name: VISUALLY.


Step 7
Click on "+ Add parameter" and search for: VisuallyExperienceName.

Step 8
Choose from the list the experience name you want to add and click on "Apply".

Step 9
Click on " + Add new parameter" and search for: VisuallyVariation.


Step 10
Choose from the list the variation.

Step 11
Click on the button "Save and apply".

Before checking your data in GA4
To view data from your Visually experience in Google Analytics 4, make sure that the "Send Events to Google Analytics" toggle is enabled within your Visually experience before publishing.
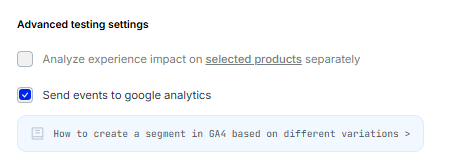
Important: Only events that occur after the Send Events to Google Analytics toggle has been enabled and the experience has been published will be sent to GA4. Events that occurred before enabling this setting are not sent retroactively.