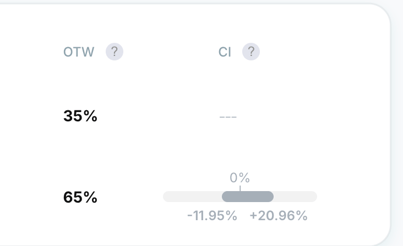
The Confidence Interval (CI) answers: "If I rolled this out to everyone, what is the likely range of the actual uplift?" This helps you understand how confident the system is in the results.
For example, if a variation has a conversion rate of 5% with a confidence interval of 4%–6%, it means the true conversion rate is probably somewhere within that range.
Think of the CI as a "margin of error" around your uplift. It consists of:
-
Point Estimate: The specific uplift percentage (e.g., +5%) shown in the report.
-
Margin of Error: The "wings" of the bell curve that show the level of uncertainty.
How to read the CI:
-
Narrow Range: High certainty. The "true" impact is very close to the reported number.
-
Wide Range: Low certainty. Usually due to low sample size or high "noise" (variability) in the data.
-
The "Zero" Rule: If the interval includes 0% (e.g., -2% to +5%), the result is inconclusive. If the entire interval is above 0%, it is a confirmed winner.
How to find the CI in reports:
The Confidence Interval is specific to the main goal of the experience.
1. Open the extra settings in the experience reports and toggle the Confidence Interval on.
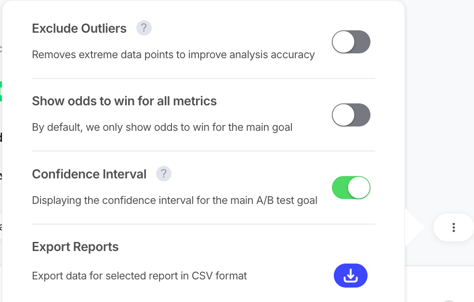
2. Once it is on, you can view the Confidence interval in the results shown next to the Odd to Win.